
With just one week left to go, we’re seeing real progress down at the dig site. We’ve finally broken past the modern deposits at both the North and South ends of our main trench.

Image: Excavating intact 18th/17th century deposits Northern end of Trench 1.
We can be reasonably confident in dating these deposits as they lie under the dense, ashy Victorian and Edwardian deposits, but still seem to contain early examples of clay pipe.
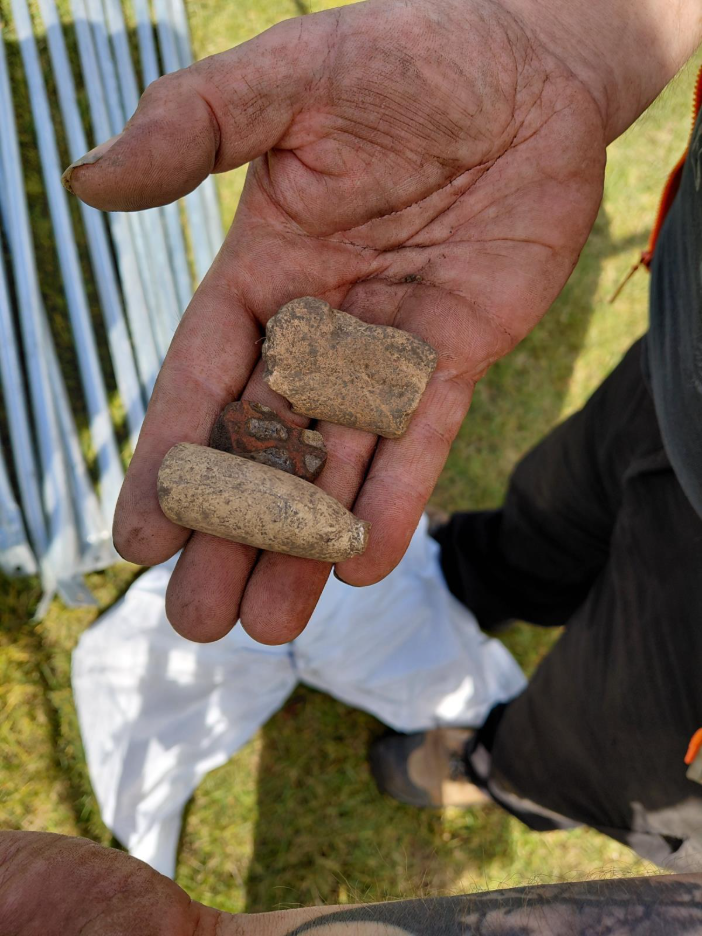
Image: An early clay pipe bowl and pottery sherds.
Clay pipes were used from the 16th century, when tabacco was first introduced to Britain from the Americas, but only really became nationally widespread in the 17th century. Every town would have had a clay pipe manufacturer, making them easy to find and affordable. So much so that when they inevitably broke due to their relatively fragile composition they were just tossed over the shoulder. As a result, they are very common finds on archaeological sites, in old gardens and pubs, even just in farmers’ fields. They can be dated based on particular designs, but mostly by their size; the further back in time you look, the more expensive tabacco was in England, so the smaller the pipe. The examples we’re finding fit the size and shape that were produced and used in the 17th to 18th century, thus giving us our rough date.
As for the mysterious pit of stone and slag; we are still very confused but making progress nonetheless!
We have opened two Test Pits’, Test Pit 2 and Test Pit 3, to continue in investigating the feature beyond the main trench. We’re confident that both our Test Pits capture the same feature, but thew differences between the two are massive.
Test Pit 2 is filled with large stone blocks which seem to be placed deliberately and with some thought. Some of these stones are bubbled and even vitrified, or melted to the point they’re shiny and glassy, which tells us they have been exposed to extremely high temperatures, probably in an industrial furnace.

Image: Test Pit 2 with its large, seemingly deliberately placed vitrified stone blocks.
Test Pit 3 on the other hand appears to be filled with a more random rubble deposit with small pieces of stone, brick and slag.

Image: Test Pit 2 with its rubble deposit.
We have some theories as to what this feature might be; a temporary war time structure was our original thought based on the features stratigraphic relationship with the rest of the deposits on site; it’s above everything else so is the most recent thing, as well as the context that the war time history of the park provides. Being completley honest though, it’s weird and we don’t really know what it is, but that’s all part of the archaeological journey. The next stage will be to record what we’ve done, maybe do a little bit more excavation, but ultimately to leave it until next year when we can (hopefully) extend the trench and find the full length of the feature in plan.
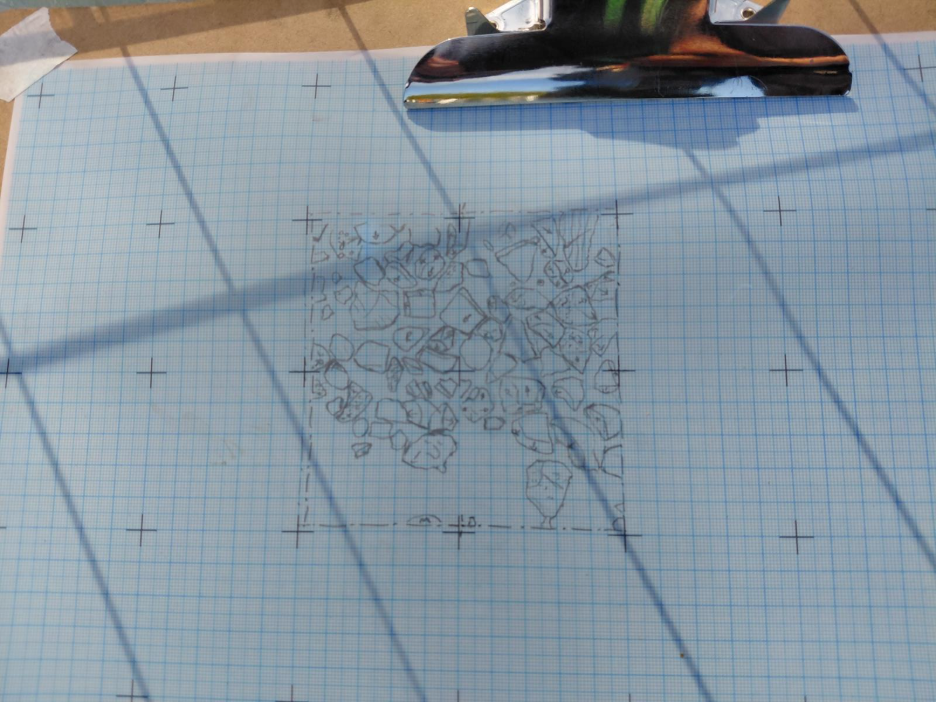
Image: Hand-drawn Plan of Test Pit 2.
You may also remember that two weeks ago our placement student Dake took photos to create a 3D model of our intact ration tin, and the results are back! Using 3D modelling techniques, we can add an extra layer to our preservation conservation methods, and we are absolutely delighted with the results which you can find by following the link bellow:
WWI Ration – 3D model by DakeJarrowHall (@DakeJarrowHall) [ba8a938]
We hope to use this method again in the future to help preserve our artefacts and make them more accessible through the website.
Now, for what must be the most frequently asked question we get on site; How did we decide to dig where we are.
Well, this is an excellent question, and the answer is through a lot of research. In 2007 (published in 2013) a study was done by Sam Turner, Sarah Semple and Alex Turner from Durham University and Newcastle University which included survey work of Drewetts’ Park. Using Ground Penetrating Radar and Magnetometry they were able to identify the Second World War remains in the park, a possible path running from Northwest to Southeast, and an irregular linear feature which the authors interpreted as a possible channel or boundary.

Image: Magnetomery survey results and interpreation (Turner, Semple & Turner: 2013).

Image: Ground Penetrating Radar survey results and interpretation (Turner, Semple & Turner: 2013).
Due to its size and irregular shape, it is likely that this linear feature predates the war time features and the path, and one theory is that this linear might be what remains of the Northern boundary of the monastery.

Image: Possible interpretation of the linear feature as the Northern boundary of the monastery (Turner, Semple & Turner: 2013).
This was our starting point. We then went on to do what we call map regression as part of our Written Scheme of Investigation (WSI) where we compared maps throughout time to look for changes in the use or boundaries of the park.

Image: Durham Sheet III Surveyed 1856 Published 1862.
This is the oldest map we were able to examine, and it shows possible earthworks which this cartographer has interpreted as a Roman Station. Whether there was a Roman station or fort in the area has not been proven. Regardless, whatever these earthworks might have been, they sadly no longer exist today.

Image: Durham Sheet III.SE. Revised 1894 to 1894 Published 1898.
This map also shows the “Roman Station”, as well as a boundary running through the park.

Image: Northumberland Street XCVIII.NE. Revised 1894-1895 Published 1899.
This map has a cross symbol in the area of the park with indicates an area of antiquities, which may still be referring to the alleged “Roman Station”. The area is not listed as a park, and with the boundary running down the middle, it may have instead been used as agricultural or common use land.

Image: Durham Sheet III a. Revised 1912 to 1913 Published 1921.
In this map the boundary line is gone, and the area is referred to as Drewett Playing Fields. It also shows the bandstand and a small structure in the Southeast corner.

Image: Durham Sheet III.SE. Revised 1938 Published 1946.
This map is very similar to the previous, showing the buildings, paths, and still the “Roman Station”.
If you are interested in doing some cartographical research of your own, the National Library of Scotland is an incredible resource for anyone looking to explore historical OS maps.
As well as this we did have a look at LiDAR data of the area but unfortunately all that seems to be definitively visible are the WW2 turning circle and barrage balloon foundations. LiDAR can be an amazing tool for archaeologists at the surveying stage of an excavation, but if the site has been extensively landscaped, as we are beginning to see in Drewetts’ Park, then there is often little can actually show us.

Image: LiDAR map of Jarrow Slake, south Tyneside, East Yorkshire, NZ3465, NZ3465 (www.archiuk.com).
We’ve also had a good look at the Historic Environments Records (HER), historical arial photography, and modern arial images.

Image: An ariel Photograph of Drewetts’ Park (1935) where a path from Church Bank to the Jarrow Village can be seen in the left of the frame (britainfromabove.org.uk).
Lastly, we have to create a rough plan of where we are ultimately going to put our trenches in a software called Geographic Information System (GIS). Ours was made with the help of our colleagues at Archaeological Research Services and shows where our trench over lies the linear feature recorded by Turner, Semple, and Turner in 2007. We also know that our trench captures the historic pathway based on the arial photographic evidence, which we have been able to corroborate archaeologically.

Image: Our Figure 2 map showing where our main trench sits in relation to the potential archaeology.
And that is how we know exactly where to dig!