
A JAM Update!
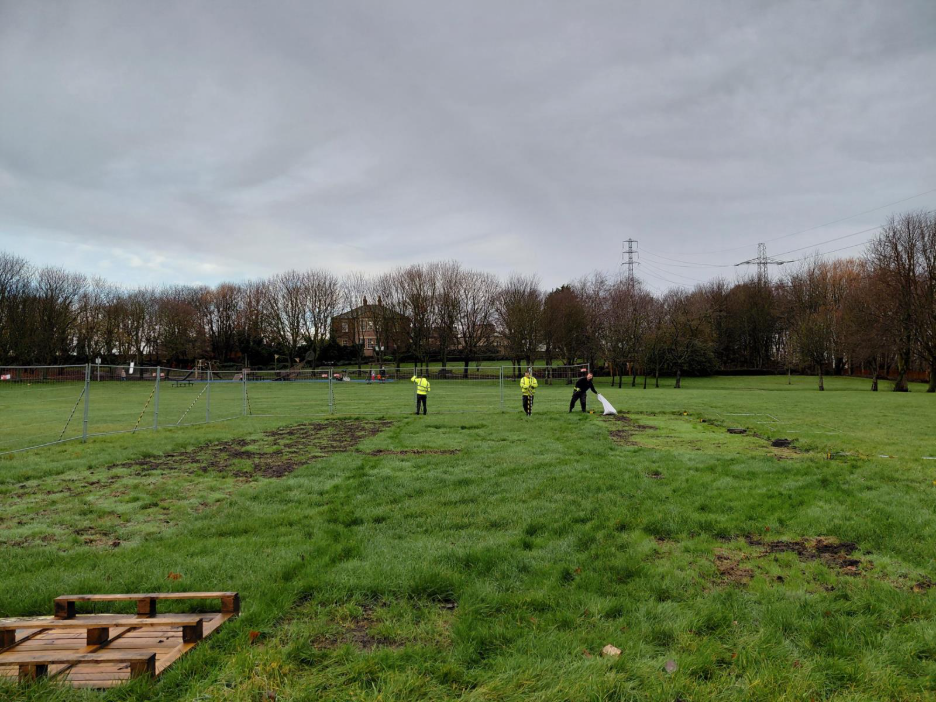
The fences in Drewett’s (Charlies) Park were taken down this morning with the very generous help of the Groundwork Land Team.
We’ve re-seeded the ground but it’s still quite squishy, so we ask that you take extra special care while in the park not to let yourself or your furry four-legged friends get stuck in the mud or trip on an uneven bit of turf. The ground just needs a little bit of time to breathe.
Thank you
For our final week of festive contemplations, we now must endure a terrifying glimpse at the future of archaeological recording; Quantum Geographic Information System!
QGIS for short.
Geographic Information System (GIS) is a software framework designed for the storage and analysis of location-based or physical data, which allows users to present this data in creative and complex ways. GIS allows us to create layers of data tethered to real physical locations. ArcGIS, specifically, is a set of tools within the all-encompassing system of GIS which are used in the creation of multi-dimensional maps and models and is often used by archaeologists, while QGIS is a free, open-source version of GIS which can be downloaded by anyone.

Picture: opening QGIS, laptop sounds like it might take-off at any moment.
It’s become very normal for Archaeologists to use ArcGIS or QGIS to analyse and present data. We used it to make maps, and it can even be used to make digital versions of field drawings.

Picture: we can insert data from various sources that we’ve made and from online and toggle them on or off to create a detailed record of site in a single location.
However, as miraculous as this all sounds, you actually have to learn to use QGIS first, and dear reader when I tell you that this has made all of our brains dribble out of our ears; please, please, believe me.

Picture: Why is the GPS point for our site off the coast of Nigeria????

Picture: That’s at least closer, I suppose?
Thankfully, we were able to spend some time with our colleagues at ARS learning how to get started. We at JAM are using QGIS to make a map of site, with layers of different information including all of the GPS data we recorded in September as well as data gathered by our friends and colleagues at Northumbria University, models of site made by our placement student Dake, and digitised versions of the drawings we made of site.
I won’t bore you with our baby steps, but I will say that if you’re ever enjoying a peaceful coffee in Hive and hear gentle weeping, you now know why.
Instead, we’ve found a few examples of the kinds of amazing things that can be done with GIS.
StoryMaps is an ArcGIS tool that allows users to tell narratives with maps, videos, and other forms of media. Its uses are almost endless.

Picture: An interactive map showing languages and their family groups across the world. This part of a National Geographic Learning module on Cultural Patterns and Processes and is available here.
GIS is used by organisations like UNESCO and by commercial archaeologists. The scale might be a little bit different, but GIS is flexible and designed to be used by everyone.

Picture: A map of UNESCO World Heritage Sites, natural and man-made, available here.
GIS can even be used to present data in ways that are more visually engaging.

Picture: A geological map of Michigan’s upper peninsula, formatted to look like cross-stitch using ArcGIS Pro, by John Nelson, available here.

Picture: A map of wind currents formatted to look like the work of Van Gogh, by John Nelson and Dan Pisut, available here.
Maybe one day we can achieve something so ingenious and artistic at JAM, but for now I think we would all settle for getting the GPS data in the right place without the laptop catching fire.
With that, we shall leave you for the duration of the festive season, but fear not, as JAM will be back with more exciting updates for the new year. We wish you all a calm, collected, and peaceful Yule.